by Karin Chernoff Kaplan, Director
HFM Blog
May 2014
Open PDF file >
Physician Compensation Fair Market Value: The Perils of “Compensation per Work RVU” Benchmarks
Many hospitals, physician groups, and consultants use published physician compensation surveys as one way to set compensation levels and limits and ensure that compensation is within fair market value. Although the data in these published surveys can be valuable, these data also, unfortunately, are easy to misapply, resulting in compensation that does not meet fair market value (FMV) standards.
Use of work RVUs to measure provider productivity is common. Typically, the premise of a work-RVU-based compensation model is to align physician effort with compensation levels through the use of published compensation surveys, such as those issued by the Medical Group Management Association (MGMA) and the American Medical Group Association (AMGA). Intuitively, if a physician produces work RVUs at the 60th percentile, his or her compensation should be at or near the 60th percentile.
Physician compensation models based on a dollar per work RVU, sometimes referred to as a conversion factor, are increasingly common. However, people often mistakenly assume that if a physician’s work RVU volume falls within a certain percentile, they can apply the corresponding published percentile compensation per work RVU data and set a compensation level that is consistent with FMV.
This couldn’t be further from the truth. If you use a conversion factor above the reported median compensation per work RVU benchmark, the calculated compensation is highly likely to exceed FMV.
Take for example a gastroenterologist who generates 10,500 work RVUs annually, putting her or him at the 75th percentile (MGMA) of productivity. Multiplying the75th percentile of compensation per work RVU ($83.55) by the physician’s actual work RVUs produces compensation of $875,000. This amount is 35 percent more than the 75th percentile compensation benchmark, and not consistent with FMV standards. This physician’s
compensation is more appropriately defined as $712,000, based on MGMA survey data alone.
This is a great disappointment to physicians, and a surprisingly hard concept to grasp. It may help to think of it this way.
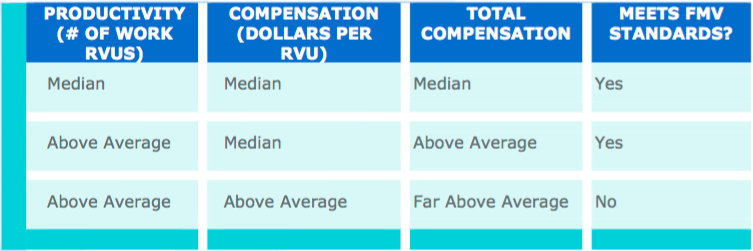
In fact, the underlying data tell us that compensation per work RVU is typically higher for lower-producing physicians and lower for higher-producing physicians. The published ratios are rank ordered by compensation per work RVU, not by physician productivity. Figures at the higher end of the scale are unlikely to be representative of compensation earned by highly productive physicians.
We recommend using no more than the median compensation per work RVU benchmark in setting total compensation for any level of production.
Any compensation model should be tested to make sure that all possible compensation remains consistent with the physician’s productivity level and therefore consistent with FMV.